Latest official child poverty statistics: 2024/25 (26 February 2026)
Latest official child poverty statistics: 2024/25 (26 February 2026)
Key Stats
Material Hardship is Rising: 14.3%, or 1 in 7, of New Zealand children (~ 169,300 kids) are now living in material hardship, meaning they regularly go without daily essentials like fresh fruit, doctor's visits, or adequate heating. This is a statistically proven increase from 2022’s 10.6%, our “best year”, meaning that 47,500 more children live in material hardship. The latest figure is a 10-year high in historical estimates.
Housing Costs Drive Severe Income Poverty: After paying for housing, 17.8% of children (~210,600 kids) live below the primary income poverty line (AHC50 Fixed). This confirms that high rents and mortgages remain a massive, structural driver of poverty. Looking at the broader supplementary measure (AHC60 Moving), about 1 in 3 children (29.9%) live in financially insecure households after paying for housing, totalling ~354,200 children. This is now comparable to levels during the 2008 Global Financial Crisis, despite the overall percentage rate being slightly lower today.
Severe and Consistent Poverty is Worsening: Around 106,000 children (8.6%) are now trapped in "consistent poverty" - meaning their families suffer from both low income and material hardship simultaneously. Furthermore, 71,000 children (6.0%) have been pushed into severe material hardship. These metrics of acute deprivation are at their highest levels in nearly ten years, highlighting a growing crisis for those at the very bottom of the income spectrum.
Stark Demographic Inequities Persist: The burden of poverty does not fall equally. Material hardship rates are disproportionately high for Pacific children (31%) and tamariki Māori (25.1%), compared to the national rate of 14.3%. Additionally, 26.9% of disabled children are living in material hardship, reflecting the severe "dual burden" of increased out-of-pocket care costs and systemic barriers to parental employment.
How to read this data
The 2024/25 Child Poverty Statistics are based on data collected from July 2023 to June 2025. This is because the Household Income and Living Survey (formerly the Household Economic Survey) runs from July to June of the designated year and asks participants about their income and living circumstances over the past 12 months.
Income figures are equivalised unless stated otherwise. Equivalisation is a practice used by StatsNZ to ensure that households with different sizes and compositions are comparable. Put simply, the total household income is standardised by dividing a score assigned to each household member. Generally, the larger and older a family is, the higher it scores.
Statistically significant: This term will appear frequently on this page. It means the collected data is accurate enough to be certain that a change definitely occurred between two points of comparison, for instance, between 2025 and another year, say 2022. When change is statistically insignificant, it doesn’t necessarily mean the poverty rate did not get worse or better; it means the data collected cannot say with certainty that a change occurred. This can be caused by high uncertainty in the collected data, or by a change so small that it is hard to be certain.
Under the Child Poverty Reduction Act 2018, poverty is tracked through a multi-layered framework that captures both low incomes and the lived reality of material deprivation.
Primary Measures (The Legal Targets): These are the core accountability metrics. The government is legally required to set 3-year and 10-year reduction targets for these measures and publicly report on their progress. The current three main headlines are:
BHC50: Income poverty before housing costs (below 50% of median income).
AHC50 (Fixed): Income poverty after housing costs (anchored to a 2018 baseline).
Material Hardship: Children in households lacking 7 or more basic daily essentials due to cost.
Note that Persistent Poverty is the fourth primary measure for reduction targets. The first official release will be in February 2027 for the year 2025/26.
Supplementary Measures (The Full Picture): The government is not legally required to set reduction targets for these, but they are vital for understanding the true depth and scale of poverty in New Zealand. Key supplementary measures include:
Severe Material Hardship: Tracks extreme deprivation (children lacking 10 or more essentials).
Broader Income Measures (e.g., AHC60 Moving): Captures the massive number of families pushed into financial insecurity by exorbitant rent or mortgages, even if their income sits just above the strict primary poverty lines.
Composite Measures (Income and Material Hardship): A supplementary measure that tracks the overlap of low income and material deprivation. It identifies children whose households fall below the AHC60 moving income line and concurrently experience material hardship, highlighting those trapped in the most persistent and entrenched poverty.
For a more detailed guide to these income poverty measurements, please see StatsNZ’s official technical document.
Material Hardship (Primary Measure)
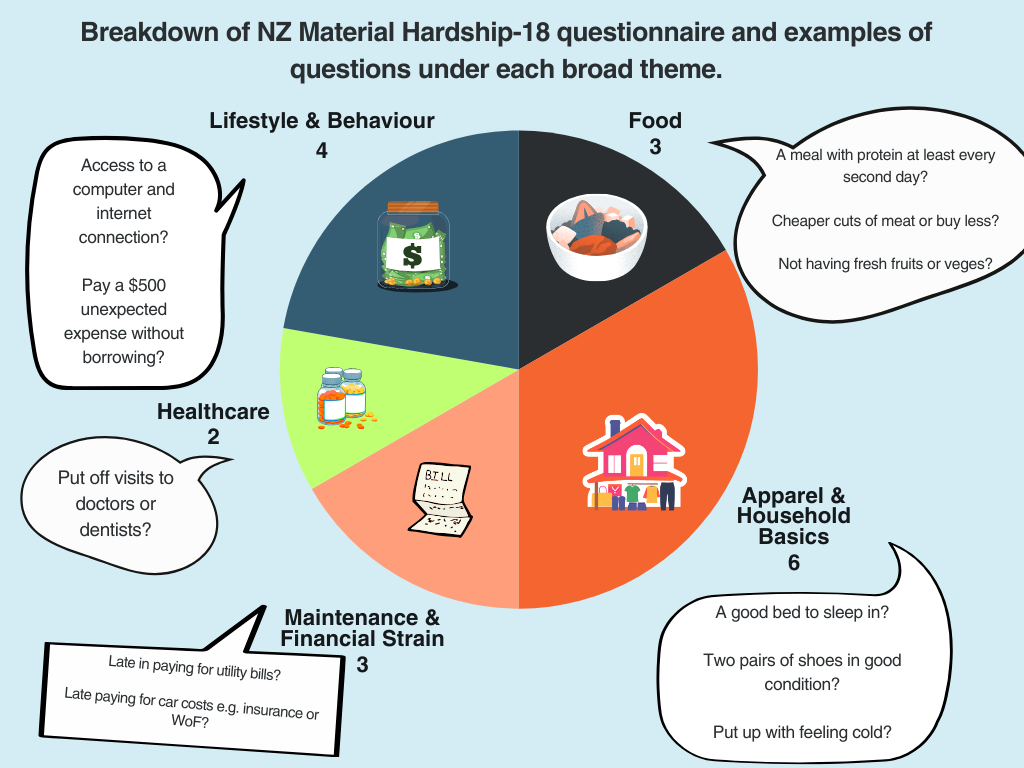
Material hardship is assessed using an 18-question questionnaire (see graph below). Yes to 7 or more questions indicates material hardship, and 10 or more indicates severe material hardship. A broad overview of the questionnaire items is available in the graphic below.
Note that StatsNZ has recently changed the way it measures material hardship. You can find the full details here and our comments about this change here.
1 IN 7 CHILDREN ARE EXPERIENCING MATERIAL HARDSHIP (14.3%)
Material hardship is a primary measure assessing the day-to-day lived reality of children, capturing those who regularly go without daily essentials. In the year ended June 2025, the material hardship rate was 14.3%, representing approximately 169,300 children. This represents a statistically significant increase from 10.6% in 2022, meaning an additional ~47,500 children are now experiencing deprivation. These upward trends indicate that material deprivation is at its highest level since 2015, pushing the country further away from the government's reduction targets.
There is a statistically significant increase in severe material hardship - a deeper level of deprivation - since 2022, from 4% to 6%. In terms of population, ~71,000 children live in severe material hardship. A ~24,400 increase from 2022.
Material Hardship in the Regions
We compared the rates of material hardship across different regions of New Zealand. From 2019 to 2024, 2021 had the greatest number of regions with statistically significant change, followed by 2025.
Between these two points in time, Northland, Wellington, and Canterbury had all experienced higher-than-average growth in material hardship, with Wellington and Canterbury being twice and Northland three times the national average.
We will be releasing a commentary discussing on regional poverty data in the coming months.
Income Poverty (Primary Measures)
When measuring income poverty in New Zealand, statisticians look at whether a household's income falls significantly below what a typical (median) family earns. The standard practice is to draw the "poverty line" at 50% or 60% of the typical income, while 40% is used to scope the most financially vulnerable. To get a true picture of how families are faring, the data is split into two key measures:
Before Housing Costs (BHC): This looks at a household’s total income before paying for their accommodation. It gives us a baseline look at the raw financial support or wages/salary a family receives.
After Housing Costs (AHC): This measures the income a family has left after rent or mortgage payments are deducted.
Because housing costs in New Zealand are incredibly high and vary drastically depending on whether you rent, own, or live in a major city, AHC is often the most telling measure of real-world poverty. It is a closer measure of what families have left to spend after paying for rent or a mortgage, and for daily essentials like groceries, power bills, doctor’s visits, appropriate clothing, and so on.
Before housing costs 50 AKA BHC50 (Primary Measure)
The BHC50 measure assesses whether a household's income falls below 50% of the median equivalised disposable income before housing costs are deducted. In 2025, the BHC50 child poverty rate was 12.6%, equating to 148,700 children. While this is a marginal decrease from 12.7% (149,200 children) in 2024, it remains significantly higher than the legislated 2024 target of 10.0%.
The table below illustrates the weekly income level at which the BHC50 poverty line is set.
After housing costs 50, fixed to a base year (2018) AKA AHC50-Fixed (Primary Measure)
The AHC50-Fixed measure assesses the percentage of children living in households with incomes below 50% of the median after housing costs, anchored to a 2018 base year. This means that the 2025 poverty line is not set against the 2025 median, but against 2018’s median, adjusted for inflation. This is what makes this a “fixed” measure.
In 2025, 17.8% of children (210,600 children) lived below this primary poverty line. This is a statistically significant increase from 2021’s 15% and 2022’s 14.6%.
The table below illustrates the weekly income level at which the AHC50-Fixed poverty line is set.
Demography of Child Poverty
The burden of child poverty is distributed unevenly across different demographics, revealing structural disparities in the economy.
Ethnicity
In 2025, Pacific children and tamariki Māori experienced significantly higher rates of material hardship at 31.0% (54,400 children) and 26% (76,900 children), respectively. By contrast, European children had a material hardship rate of 11.5% (86,000 children), and Asian children were at 5.9% (14,700 children). Disparities also exist in income poverty: the AHC50-Fixed rate is 20.2% for Pacific children and 18.9% for Māori children, compared to 15.2% for European children.
While Asian communities report relatively high rates of income poverty, this does not translate into proportional rates of material hardship. This well-documented disparity is largely driven by a combination of household structures and wealth buffers. Asian families have a higher prevalence of multi-generational living, which creates significant economies of scale and reduces core budget demands through shared resources (such as in-house childcare). Additionally, the Asian demographic includes a large proportion of recent migrants and international students who may report low New Zealand-taxable incomes, but rely on overseas savings, family support, or self-employment structures to meet their day-to-day material needs without experiencing enforced deprivation. The high disparity in income and material poverty among Asian ethnic groups is explored in greater depth in Bryan Perry’s work (see Household Income Report 2019 and Child Poverty Reports).
Disability Status
Households impacted by disability are squeezed from both sides, facing disproportionate financial strain. Not only must they absorb significant extra weekly living costs, but they also experience restricted earning potential, as parents frequently have to reduce their paid work hours to manage caregiving responsibilities, or face employment barriers as disabled adults.
In 2025, the material hardship rate for disabled children was 26.9%, more than double the 12.7% rate for non-disabled children. When looking at the wider household unit, 27.5% of children living in a household with at least one disabled member experienced material hardship, compared to 8.4% of children in households with no disabled members.
Consistent Poverty (Supplementary Measure)
Consistent poverty is defined as living in a household with an income below 60% of the median (after housing costs) while simultaneously experiencing material hardship. This measure aims to identify households that fall into both income and material poverty, since the two may not be synonymous in practice. That is to say, having low income may not necessarily mean the household is materially deprived under StatsNZ’s Material Hardship 18 Questionnaire assessment and vice versa.
In 2025, the consistent poverty rate rose to 8.6%, trapping 101,600 children. This is a statistically significant increase from 2022, when the consistent poverty rate was 5.8% (~67,200 children) - historically, our “best” year.
More importantly, this measure is returning to a level similar to that observed in 2018, when the Child Poverty Reduction Act was introduced. However, due to child population growth, the sheer number of children in consistent poverty is greater than in 2018.
Housing & Severe Poverty (AHC60-50-40, Supplementary Measures)
Supplementary measures track poverty relative to the current year's median income (AKA “moving line” or “relative measure”) after housing costs, revealing how lower-income households are faring compared to the middle of the pack. CPAG has long advocated for these measures and for the children below these poverty lines to be at the centre of the Government’s attention.
In 2025, 29.9% of children (354,200 kids) lived in financial insecurity below the AHC60 line. Deeper poverty is also prevalent, with 21.5% of children (254,500 kids) falling below the AHC50 moving line. At the most extreme end, 13.4% of children (158,100 kids) were experiencing deep poverty below the AHC40 line. The weekly income level is illustrated in the table below for select example households.
How are we doing with hitting our goals?
Under the Child Poverty Reduction Act 2018, the New Zealand government is legally required to set, report on, and meet both three-year and ten-year targets to reduce the number of children living in income poverty and material hardship. Established by the previous government, the Act used 2017/2018 data as its baseline to track progress across three primary measures: material hardship, income poverty, both before and after housing costs (BHC50 moving and AHC50 fixed). While CPAG welcomed this legislation as a tool for strict public accountability, we consistently warned that even these initial targets would require transformative, structural policy shifts rather than a "business as usual" approach.
The 2024 Target Failure
Because the statutory targets are evaluated in three-year cycles, the 2024 data served as the official deadline for the second intermediate targets and a checkpoint for reaching its 10-year goal in 2028. As per the advice of the Child Poverty Wellbeing and Reduction Group to the Minister, the statistics reveal a stark disconnect between legislative promises and the reality on the ground: successive administrations have failed to implement the policies necessary to reach these goals, resulting in the government comprehensively missing all three primary reduction targets for 2024
Most concerningly, the target for Material Hardship was to reduce the rate to 9.0% by 2024. Instead, the actual figure surged to 13.5% - pushing the rate even higher than the original 13.3% baseline established in 2018. This failure is particularly alarming because material hardship reflects the lived, day-to-day reality of children going without essential items such as fresh food, warm clothing, and access to doctors. Income poverty targets were similarly missed, with BHC50 sitting at 12.7% (against a 10.0% target) and AHC50 fixed at 18.2% (against a 15.0% target).
The 2025 Reality and the Lowered Ambition for 2027
As the newly released 2025 statistics show, the situation has deteriorated even further past the 2024 benchmark. Rather than course-correcting, official documents and Treasury forecasts reveal that the current government has effectively abandoned the trajectory needed to meet the ambitious 2028 ten-year goals (which legally require material hardship to plummet to just 6.0%). In setting the third intermediate targets for 2027, OIA documents reveal the Minister for Child Poverty Reduction rejected official advice to implement policies that would get New Zealand back on track. Instead, the government opted to lower the targets to align with dismal economic forecasts. This ensures that without urgent, structural policy intervention, the government will continue to fail its most vulnerable children.
What policy changes impacted child poverty from July 2023 to June 2025?
Note: This date range reflects the exact data collection reference period for the latest Stats NZ child poverty statistics, capturing the reality for families regardless of which government was in power.
2024 marked the year in which key changes were made to NZ’s income support system, such as the “Welfare to Work” initiative. Amongst its changes, CPAG and the Fairer Future movement have been very vocal about their adverse effects on child poverty, particularly benefit indexation and sanctions.
Changes to Main Benefit Indexation: On 1 April 2024, the indexation of main benefits was reverted to the general Consumer Price Index (CPI), abandoning the previous system of tying increases to average wage growth. Wage growth generally outpaces CPI and better reflects the true rising costs of essentials like housing, food, and utilities. This change compounds over time, leaving families receiving benefits progressively further behind the rest of society and deepening income poverty.
Introduction of Stricter Benefit Sanctions: From August 2024, the government implemented a harsher sanctions regime under which payments can be reduced or paused if work-preparation obligations are not met. MSD’s own quarterly data confirms a sharp rise in sanctions being issued, including to households with children. Sanctions directly and immediately plunge families into severe income poverty and material hardship, penalising children for parental compliance issues.
Sudden Restrictions on Disability Support Services (DSS) Funding: In March 2024, the government imposed immediate, unconsulted limits on how disabled people and their families could use their support funding. This severely restricted the flexible "Enabling Good Lives" approach, strictly limiting families' ability to purchase customised equipment, access vital respite care, or cover travel and accommodation for carers. As CPAG highlighted, this sudden loss of flexible support plunged many families into "survival or crisis mode". Without accessible respite care, parents of disabled children face an intensified dual burden: they must absorb increased out-of-pocket care costs while their capacity to maintain paid employment is drastically reduced. Although a reversal of these strict guidelines has been announced for 2026, the restrictions enforced during this reporting period directly drove up severe material hardship rates for households impacted by disability. There are also concerns that the Government budget for the restored Disability Support Services is based on past 2023-2025 expenditure levels. During a period when the restrictive policy and spending were in place, it is highly likely that the funding level will not be sufficient.
In addition to the above income support changes, the following policy shifts and changes to living costs significantly influenced family incomes and material hardship during this period:
Housing Policy Shifts and Public Housing Halts: Housing remains the largest drain on low-income budgets. During this period, the government reinstated interest deductibility and reduced the bright-line test for landlords, policies intended to put downward pressure on rents, though evidence of this reaching tenants is limited. For instance, the Household Income and Housing Costs statistics, which accompanied the Child Poverty Statistics, showed that housing costs have risen in the period, even after the implementation of rental interest deductibility.
"For lower income households (disposable income under $72,600), 60.6 percent of mortgage holders and 57.7 percent of renters spent at least 40 percent of their income on housing costs." - StatsNZ (26 Feb 2026)
Concurrently, funding and development for new Kāinga Ora public housing projects were halted or placed under review. This severely impacts families in emergency housing or those struggling with severe housing unaffordability (AHC poverty).
FamilyBoost vs. Universal Free ECE: From 1 July 2024, the government implemented the FamilyBoost policy (a partial rebate system) rather than proceeding with the planned extension of 20 hours of free Early Childhood Education (ECE) to 2-year-olds. Because FamilyBoost requires parents to pay upfront and claim a reimbursement later, CPAG has pointed out that it creates an insurmountable cash-flow barrier for families already in poverty. This reduces the opportunity for parents (primarily mothers) to re-enter the workforce, directly restricting families’ earning opportunities. The first iteration of the policy also had very limited coverage, with some analysts suggesting that only 249 families were eligible for the full rebate.
Removal of Public Transport Subsidies: The cessation of half-price public transport and the end of free fares for children and youth (effective May/June 2024) placed a sudden, unavoidable new cost on low-income households. As highlighted by Free Fares, this effectively erased any minor tax relief for many working families and acts as a barrier to accessing education, employment, and essential services.
Reduced Funding for School Lunches: In Budget 2024, the Ka Ora, Ka Ako (Healthy School Lunches) programme was retained but with severely reduced funding, halving the allocation from $6–$7 to just $3–$3.50 per meal. Reducing the nutritional quality or portion sizes shifts the cost of food back onto struggling parents. In the child poverty statistics, this directly exacerbates Material Hardship (MH-18) scores, as families are forced to redirect their limited budgets toward school meals, often delaying payments on utility bills or buying fresh produce for the home. CPAG raised concerns over why food insecurity is so high within the context of reduced spending for the Ka Ora, Ka Ako programme.
Below-Inflation Minimum Wage Adjustments: Minimum wage increases in 2024 (to $23.15) and 2025 were kept exceptionally low, falling below general inflation and failing to cover the skyrocketing costs of core essentials. The gap between the minimum wage and the Living Wage has widened drastically; in 2022, the gap was $2.45 per hour, but by 2024/2025, this gap expanded to over $4.65 per hour, locking many working parents into in-work poverty. CPAG has shown that minimum-wage work is not a guarantee of escaping poverty.
Inequalities in New Zealand
Uneven Growth of Income
Since 1982, incomes for the top 10% of earners have skyrocketed by 71%, while incomes for the bottom 10% have largely stagnated, growing just 11%. In just over four decades, the income multiplier between the top and bottom deciles has surged. High-income earners now earn 5.6 times more than those at the 10th percentile, up from a factor of 3.6 in 1982.
Unequal Wealth Share
Wealth in New Zealand is highly concentrated. For the year ended June 2024, the wealthiest 10% of New Zealand households held 48.5% of the country’s total wealth. Conversely, the bottom 20% owe more than they own, holding a negative share (-0.2%) of the country's wealth. To put this into perspective, 85,000 households had a net worth between negative $100,000 and $0, and an additional 24,000 households had a net worth falling below negative $100,000.
Labour Market Inequalities
While policymakers frequently assert that education and employment are the surest routes out of poverty, the reality of New Zealand’s labour market reveals a deeply uneven playing field that traps many families in hardship despite their best efforts. Having a job does not guarantee financial security; historically, in 2013, 1 in 10 (10%) children in working households remained below the poverty line, and in 2022/23, 54% of children in material hardship lived in working households. Employment must be secure, with appropriate pay, and appropriate for caregivers of children.
Even when individuals successfully navigate the tertiary education system, equal qualifications do not guarantee equal pay. As the engineering graduate chart below demonstrates, structural biases persist; seven years after graduating with the same credentials, non-Pākehā professionals face a persistent and substantial wage gap compared to their Pākehā peers. When families are burdened by user-pays student debt but denied fair wages and equal progression, the promised "silver bullet" of education misfires, cementing systemic inequalities and leaving the next generation of children to bear the cost of this precarity.