Estimating the Additional Income Needed to Address Higher Deprivation Levels of Children in Households with Disabled People
This article was first published by Te Herenga Waka | Victoria University of Wellington and is republished here with permission.
Authors: Moira Wilson, Keith McLeod and A. Jonathan R. Godfrey
Abstract
Children living in households with disabled people have a rate of material hardship three times that of children living in households with no disabled people. The rate of severe material hardship is almost four times higher. This article aims to improve the evidence base to inform policy responses to these inequities. It uses pooled Household Economic Survey data to estimate how much additional income is needed to reduce levels of deprivation to match those of households with children with no disabled people. Examples of the estimated additional income needed range from $8,400 to $24,000 per annum on an equivalised income basis and vary depending on where the household’s income sits in the income distribution. The additional income needed is higher when there are two or more disabled people in the household than when there is one disabled person.
Acknowledgements
We are grateful to members of an Expert Reference Group, the Disability Data and Evidence Community of Practice and the Disabled People’s Organisations Coalition for helpful discussions. Officials from the Ministry of Health, the Ministry of Social Development, the Social Investment Agency, Stats NZ, Whaikaha – the Ministry of Disabled People and the Treasury provided insightful and constructive comments on earlier drafts. Particular thanks are due to Sarah Crichton (the Treasury) and Diane Anderson (Ministry of Social Development) for helpful peer review.
Disclaimer
These results are not official statistics. They have been created for research purposes from the Integrated Data Infrastructure which is carefully managed by Stats NZ. For more information about the Integrated Data Infrastructure please visit https://www.stats.govt.nz/integrated-data/.
The results are based in part on tax data supplied by Inland Revenue to Stats NZ under the Tax Administration Act 1994 for statistical purposes. Any discussion of data limitations or weaknesses is in the context of using the Integrated Data Infrastructure for statistical purposes, and is not related to the data’s ability to support Inland Revenue’s core operational requirements.
The views, opinions, findings, and recommendations expressed in this report are those of the authors. They do not necessarily reflect the views of the Ministry of Social Development, or people involved in advisory or peer review process. Any errors or omissions are our own.
Introduction
Disabled people and the families, whānau and carers of disabled people can face significant additional costs and unmet needs that stem from the interaction of impairment and an inaccessible society (Disability Resource Center, 2010; Mitra et al., 2017). Additional disability-related costs can include the direct out-of-pocket costs required for health service visits, transport, special diets, medication, help with daily activities, and disability-related equipment and aids. They can also include indirect ‘opportunity costs’, including additional time and energy costs for daily living and limits on participation in paid employment.
In Aotearoa New Zealand (NZ), some payments within the income support system and a range of other government-funded supports acknowledge these additional costs (Table 1). How well these payments and supports compensate for or offset additional costs is hard to assess, however. A developing international literature suggests there are sizeable total and uncompensated additional costs for disabled people but with a wide range of estimates of their scale (Mitra et al., 2017).
Table 1: Selected government-funded health- and disability-related payments and other supports for working-aged people and children as at 1 July 2024.
Analysis of Household Economic Survey (HES) data shows that of NZ families in the most extreme hardship, around half have a disabled family member (Stephens, 2022). In child poverty monitoring, being in material hardship is defined as having six or more of the 17 restriction items that make up the Dep-17 deprivation index (see Box 2 below and Perry (2022)). Severe hardship is defined as having nine or more of the 17 restriction items. Pooled data from the 2019/20, 2020/21, and 2021/22 HES show the rate of material hardship was three times higher for children in households with a disabled person than for other children (21.2% compared with 6.9%) and the rate of severe material hardship almost four times higher (9.6% compared with 2.6%). However, average equivalised household income (ie. adjusted for household size and composition) for children in households with a disabled person was above 85% of the average household income of other children (Wilson and McLeod, forthcoming).
A range of factors can explain wide differences in material hardship despite modest differences in equivalised income. These include differences in levels of financial assets (eg. savings and investments net of debts), physical assets (eg. home ownership, consumer durables), assistance from outside the household (from family, whānau, friends, community, or government) the ability to convert given resources into valuable consumption, the ability to access available resources, and the size of housing costs and employment-related costs (eg childcare). Importantly, they also include disability-related extra costs and disability-related limits on paid employment (Perry, 2022; Stephens, 2022).
Several approaches have been used in the international literature to estimate the additional costs associated with disability. These can be categorised into:
subjective approaches, which typically ask disabled people about their additional costs
comparative approaches, which contrast the actual expenditure of disabled and non-disabled people
budget standards approaches, which involve the construction of a list of items and services which are required for disabled people to meet a ‘reasonable’ standard of living (SOL)
SOL approaches, which explore the difference in incomes for disabled and non-disabled people who have the same SOL and take this as a measure of additional costs (Mitra, 2017; Melnychuk et al., 2018).
The different approaches each have limitations (Mitra, 2017; Melnychuk et al., 2018; Mont, 2023). For example, subjective and comparative approaches may underestimate costs of disability where unmet needs exist due to lack of affordability or access to goods and services. Budget standards approaches do not generally estimate the additional cost associated with disability, as there is typically no comparison with the non-disabled. SOL approaches do not provide an estimate of the costs required for full participation, or provide any insight into what goods and services are needed. They also have potential methodogical limitations which we discuss in more detail below.
Several previous NZ studies have examined or touched on additional costs of disability (Box 1). This article’s aim is to further strengthen the NZ evidence base for future policy development. We begin by setting out and applying a simple, descriptive SOL approach to provide estimates, at points in the income distribution, of how much additional income is needed to reduce levels of deprivation of households with children and disabled people to levels that match households with children with no disabled people. We then look at the feasibility of two SOL approaches most commonly used in the international literature to arrive at an overall average cost-of-disability estimate and outline the limitations with these approaches we encountered. The interpretation and implications of our findings are discussed.
Previous NZ studies
The Disability Resource Centre (2010), HealthiNZ (2024), and qualitative interviews undertaken in 2022 (Cram et al., forthcoming; Gray and Stratten, forthcoming), asked disabled people and people in families and whānau with a disabled person about the costs they face. Costs mentioned range from disability-related care and equipment and health costs, to extra costs associated with special food or transport and housing that meets accessibility needs. People talked about ways these costs sometimes go unmet because they are unaffordable, and ways in which self-funding costs limits the amount available for other essentials, including food, dental treatment, educational resources and activities for children, and travel to maintain connections with family, whānau and culture.
The Disability Resource Centre (2010) used the budget standards approach to cost the additional resources (support, equipment, transport and time) that disabled people with physical, sensory, intellectual and mental health impairments need to live in the community. The estimates were for examples of disabled people aged 18-64 with no children, without multiple impairments, and with ranges of need characterised as ‘high’ and ‘moderate’. A process of discussion with disabled people was used to define and cost baskets of goods, services and activities required to achieve an ordinary standard of living. Indicative costs ranged from $204 to $2,568 per week (in 2006-dollar terms).[4] How much of these costs were not compensated for by income support and government-funded support services was not estimated.
Godfrey and Brunning (2009) examined the costs faced by the blind and vision-impaired community. Focusing on short-distance non-optional taxi costs as an example, they demonstrated that the true cost of blindness was substantially underestimated if only actual incurred costs are considered. Allowing for those who would have spent more on this form of transport to mitigate the effects of blindness if they had been able to afford it, the estimated average cost of taxis rose from $14.52 to $23.43 per week (in 2004-dollar terms). This increase was likely to be conservative as whether affordability was a constraining factor was unknown for a third of the sample on which the analysis was based. These results suggest considerable unmet true costs of blindness, even with the Total Mobility scheme and Disability Allowance.
Doran et al., 2022 conducted surveys and workshops to explore the transport experiences of disabled people. The data showed that disabled people’s transport-related effort and cost were increased due to a lack of accessible direct routes to destinations and limited transport choices. Financial and non-financial costs meant trips they would otherwise like to make were foregone.
Norris et al., 2023 conducted a randomised controlled trial of exempting people with high health needs and living in areas of high deprivation from a $5 prescription charge. Removing the charge had a substantial and statistically significant effect on the odds of being hospitalised suggesting that better meeting costs of disability and health conditions for people with high health needs and living in areas of high deprivation can lead to improvements in health. Observational research also shows prescription unaffordability is associated with higher rates of hospitalisation (Jeffreys et al., 2024).
Wynd (2015) conducted interviews with caregivers of disabled children. The conversations suggested payments and supports need to better reflect the costs of being disabled or caring for a disabled child, and be reviewed to improve ease of access and coverage.
A comparative study by Murray (2018) observed that while in NZ households with disabled children are significantly more likely to experience income poverty, this is not the case in the United Kingdom (UK). In the UK, disability-related allowances for children are three times higher than in NZ. The author advocates for changes to better meet the direct and indirect costs of disability in NZ. These include increasing disability-related allowances and improving other supports for parents and carers, including support for employment.
A descriptive SOL approach
A simple, descriptive SOL approach is to compare mean SOL scores for households with and without a disabled person at different income levels. We can then use these comparisons to estimate how much additional income the households with a disabled person need to achieve the same SOL.
We apply this approach using a pooled data from the 2019/20, 2020/21, and 2021/22 HES. This yields a sample of 13,695 households with children aged under 18 (4,044 with one or more disabled person, 9,651 with no disabled person). We fit separate curves[5] to scatter plots of SOL scores plotted against household equivalised disposable income (‘SOL-income curves’).[6]
SOL is measured using the ‘Dep-17’ deprivation index (Box 2). Income is calculated by Stats NZ on based survey responses and administrative data linked to the HES in the Stats NZ Integrated Data Infrastructure. The calculation of income includes health- and disability-related income support payments, but excludes the value of in-kind supports provided via e.g. the Community Services Card, Total Mobility scheme, or Disability Support Services.
We compare fitted SOL-income curves for households with and without a disabled person. Disability status is based on Washington Group measures from the HES (Box 3). In addition, we distinguish between households with one, and with two or more disabled people. Results are presented for households with children overall, and for households with children where any household member is Māori[7] compared with households where no household member is Māori.[8] Results use unweighted data for simplicity, although we tested the sensitivity to using sample weights.
Estimated 95 percent confidence intervals are shown graphically. As with the fitted curves, confidence intervals were calculated using unweighted data, and they do not account for the complex sample design. This is likely to result in underestimation of the standard error, resulting in confidence intervals which are too narrow. We estimate that were we to take account of the survey design, confidence intervals could be up to 80 percent wider than those presented here, depending on the population being examined.
When presenting the estimates graphically, the top and bottom ends of the income distribution are excluded. At the bottom end of the distribution, households with very low incomes have higher SOL than households with somewhat higher incomes (Perry, 2022) and therefore are problematic for our approach.[9] At the top end of the income distribution SOL measures are unlikely to be accurate, given their focus on measuring material deprivation, while points on which to fit the SOL-income curves are also sparse, particularly for households with a disabled person.
Items in Dep 17
Enforced lack of essentials (for respondent or household as a whole):[10]
meal with meat, fish or chicken (or vegetarian equivalent) at least each 2nd day
two pairs of shoes in good repair and suitable for everyday use
suitable clothes for important or special occasions
presents for family and friends on special occasions
home contents insurance
Economised, cut back or delayed purchases ‘a lot’ because money was needed for other essentials (not just to be thrifty or to save for a trip or other non-essential):
went without or cut back on fresh fruit and vegetables
bought cheaper cuts of meat or bought less than wanted
put up with feeling cold to save on heating costs
postponed visits to the doctor
postponed visits to the dentist
did without or cut back on trips to the shops or other local places
delayed repairing or replacing broken or damaged appliances
In arrears more than once in last 12 months (because of shortage of cash at the time, not through forgetting):
rates, electricity, water
vehicle registration, insurance or warrant of fitness
Financial stress and vulnerability:
borrowed money from family or friends more than once in the last 12 months to cover everyday living costs
feel ‘very limited’ by the money available when thinking about purchase of clothes or shoes for self (options were: not at all, a little, quite limited, and very limited)
could not pay an unexpected and unavoidable bill of $500 within a month without borrowing
Note: Around half of all households with children report none of these deprivation items. (Source: unpublished Stats NZ analysis).
Washington Group measures used as a disability indicator in the HES
Whether a person is disabled or not has been able to be assessed using HES data since 2019/20. International Washington Group questions on functioning have been used to derive disability indicators where:
people aged 18 or over are considered disabled based on the amount of difficulty they have with seeing, hearing, walking or climbing stairs, remembering or concentrating, self-care, communication (expressive and receptive), upper body activities, and affect (depression and anxiety) – the ‘Washington Group Short Set on Functioning – Enhanced’ indicator (Washington Group, 2020a)
children and young people aged 5 to 17 are considered disabled based on the amount of difficulty they have with seeing (even with glasses), hearing (even with hearing aids), walking, feeding or dressing themselves, communicating, learning, remembering, concentrating, accepting change, controlling their own behaviour, making friends, anxiety, or depression – the ‘Washington Group / UNICEF Child Functioning Module – Ages 5-17 Years’ indicator (Washington Group, 2020b)
children aged 2 to 4 are considered disabled based on the amount of difficulty they have with seeing (even with glasses), hearing (even with hearing aids), walking, manual dexterity, communicating, learning, playing, or controlling their own behaviour – the ‘Washington Group / UNICEF Child Functioning Module – Ages 2-4 Years’ indicator (Washington Group, 2020c).
Results
Figures 1 and 2 display the fitted curves for households with children overall. They show the relationship between Dep-17 scores and equivalised household disposable income by the presence and number of disabled people in the household respectively.
Mean Dep-17 score (i.e. the average number of deprivation items listed in Box 3 reported by households) falls with increasing income. At all points, the mean Dep-17 score is higher in households with a disabled person than in households with no disabled person. The fitted curves flatten and converge to mean Dep-17 scores between zero and one at the high equivalised income bands. As noted, material hardship is defined as having a Dep-17 score of six or above. For households with two or more disabled people at the lowest equivalent income levels, the mean Dep-17 is close to this level.
For context, median equivalised household disposable income was $38,000 in households with a disabled person and $45,000 in households with no disabled person (in 2022-dollar terms).[11] One-person households are the reference point for equivalisation. This means that the income levels displayed should be thought of relative to the needs of a one-person household in terms of value. In 2022 annual net income from Supported Living Payment for a single person was around $19,000. This increased to around $22,000 if maximum Disability Allowance was received and around $31,000 if maximum Accommodation Supplement was also received. A single person with $40,000 net annual income had no entitlement main benefits such as Supported Living Payment[12] or Disability Allowance due to their income. They may have qualified for Accommodation Supplement depending on their housing costs and area.
Figure 1. SOL-income curves fitted to plots of Dep-17 score by equivalised annual household income (in 2022 dollar terms) by the presence of disabled people in the household, households with children aged under 18

Figure 2. SOL-income curves fitted to plots of Dep-17 score by equivalised annual household income (in 2022 dollar terms) by the number of disabled people in the household, households with children aged under 18

Table 2 provides examples of the additional income needed to address the higher levels of deprivation for houseolds with disabled people at selected income levels. Each example is derived by reading horizontally from Figure 1 how much income needs to slide to the right in order for households with disabled people to have the same mean Dep-17 as households with no disabled person. By way of example, at $20,000, a household with no disabled people has a mean Dep-17 score of 3.14. Households with one or more disabled people have this mean Dep-17 score at $38,600, $18,600 higher.
At higher income levels, where the SOL-income curves flatten, any variation in the gradient of the estimated curve could result in large difference in our estimates. For this reason, we confine Table 2 to estimating the income needed a $20,000, $30,000, and $40,000 income. If we were to estimate additional income for incomes in excess of $40,000, comparable incomes for households with disability would be well in excess of $50,000, at a point in the distribution where the fitted curve is both flat and imprecise, as evidenced by the widening confidence intervals at these levels of income.
At each of the three income level considered, the additional income needed is higher for households with two or more disabled people than for those with one disabled person. However the relationship between income level and the additional income needed to achieve the same mean Dep-17 is less straightforward. It falls as income increases between $20,000 and $40,000 overall and for those with one disabled person in the household. In contrast there is no drop between $30,000 and $40,000 for households with two or more disabled people.
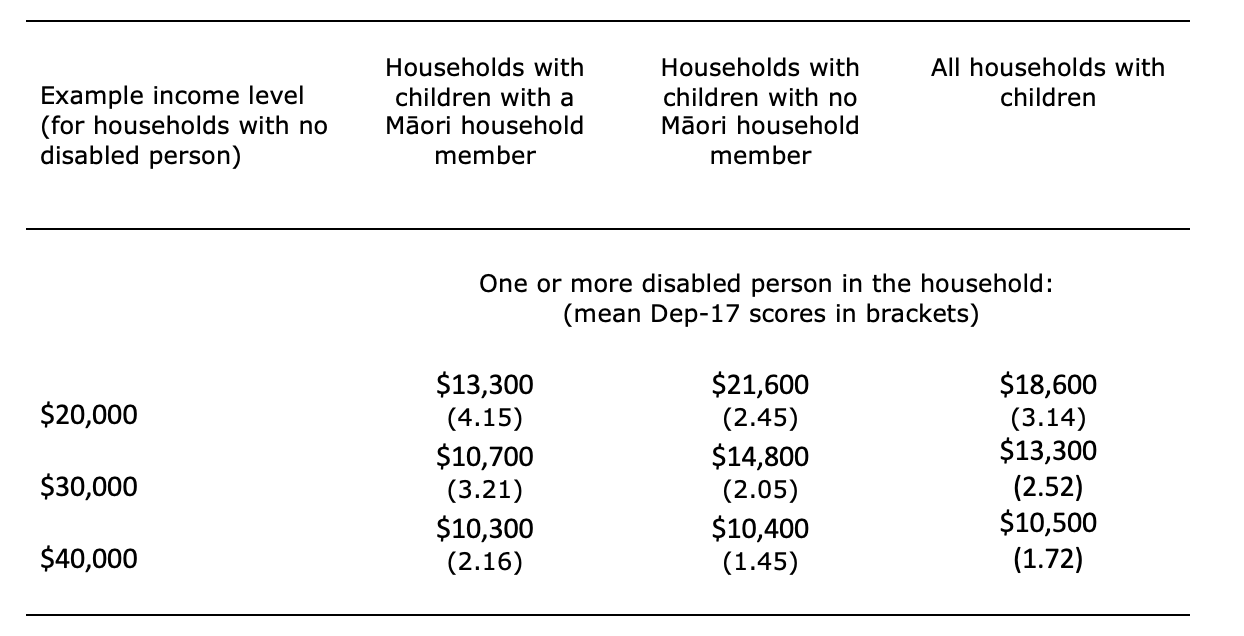
Table 2 Additional equivalised income households with a disabled person need in order to have the same mean Dep-17 score as households with no disabled person, examples at different points in the income distribution, households with children aged under 18 (in 2022 dollar terms)

Figures 3 and 4 display fitted curves for households with children, with and without Māori household members, by presence of disability in the household. Table 3 examines the additional income needed for households where there is at least one versus no Māori household member.[13] Only the case of one or more disabled person in the household is presented. The data do not support examining the case of one versus two or more disabled people. At $20,000 and $30,000, the additional income needed is lower for households with a Māori household member than for households with no Māori household member. At $40,000, the amount is similar for the two groups. At each of the income levels, the mean Dep-17 score is higher in households with a Māori household member.
Figure 3. SOL-income curves fitted to plots of Dep-17 score by equivalised annual household income for households with Māori household members (in 2022 dollar terms) by the presence of disabled people in the household, households with children aged under 18

Figure 4. SOL-income curves fitted to plots of Dep-17 score by equivalised annual household income for households with no Māori household members (in 2022 dollar terms) by the presence of disabled people in the household, households with children aged under 18

Table 3 Additional equivalised income needed for households with Māori household members versus other households, examples at different points in the income distribution, households with children aged under 18 ( in 2022 dollar terms)
We tested sensitivity of the overall results to using the Material Wellbeing Index (Perry, 2022), rather than Dep-17, as the indicator of SOL. Estimates were broadly similar. Using weighted rather than unweighted data did not materially change the findings or interpretations. We also ran the same analysis for households with no children aged under 18 and no adults aged 65 or over. Estimates of the additional income needed ranged from $6,000 to $27,100.[14]
Looking at the feasibility of SOL approaches that provide an overall average cost-of-disability estimate
Two approaches are used in SOL studies internationally to provide an overall average cost-of-disability estimate. The most commonly used approach is to use the average difference in incomes for disabled and non-disabled people who have the same SOL as a measure of overall average additional costs. This involves constructing regression models of the relationship between SOL and income for families or households with and without a disabled person (Box 4). Regardless of the income term used in the regression model, the functional form of the model imposes one of two strong assumptions on the shape of the SOL-income curve, and through those relationships on the estimated cost of disability. These are either that the costs of disability are constant across the income distribution (where actual, linear income is considered), or that costs of disability are increasing across the income distribution (where logged income is considered).
Regression-based SOL models
In regression-based models, SOL is generally assumed to increase monotonically with increasing income in a linear or non-linear fashion. Disability is assumed to shift the SOL-income curve to the right as more income is required to achieve the same standard of living. This is typically represented as a regression model such as:

where S represents a measure of SOL, Y represents income (in practice logged income is often used, reflecting diminishing returns of additional income on SOL), and D is a binary indicator reflecting the presence of a disabled person. Parameters and reflect the impact of income and the presence of a disabled person, respectively, on income. The additional cost of disability (C) for any level of standard of living is then expressed as:

In the case where the income term is not transformed, as in equation (1), the impact of disability is invariant to income. This is a direct result of the functional form in (1) which assumes that disability impacts SOL equally, regardless of income, and that changes in income of the same magnitude have the same impact on SOL regardless of where on the income distribution someone lies.
In the case where logged income (i.e. ) is included as covariate in equation (1), equation (2) resolves to:

and the cost of disability expressed as a percentage of income ( can be calculated as:

In this case, cost of disability varies according to income , while the relative cost of disability is invariant to income, i.e. the cost of disability is larger in dollar terms with higher income, or constant in percentage terms.
Hancock et al. (2013) use data for Great Britain to highlight the poor robustness of these regression-based cost-of-disability estimates, with small breaches of the assumptions resulting in large positive biases in the estimated cost of disability. To test the feasibility of the approach, we examined the plausibility of the underlying assumptions using the pooled HES data. We ran separate SOL models at the household level with linear and logged income within broadly partitioned income bands. In all models, the parameter estimates for the income bands[15] did not conform with the assumed relationships across the income distribution and varied considerably from model to model. As with Hancock et al. (2013), this is particularly troubling in a context in which any mis-specification of the SOL-income curve can have a large impact on the estimated cost of disability.[16]
Hancock et al. (2013) introduce an alternative approach which does not require a fixed specification of the shape of the SOL-income curve to estimate the additional costs experienced by older people in Great Britain. This approach used propensity score matching to estimate the overall average costs of disability. Disabled people were matched with comparison non-disabled people chosen to be as close as possible in terms of observable personal characteristics and their achieved SOL. Differences in income between the disabled group and the matched comparison group were then assumed to relate to the additional income required for disabled people to achieve the same SOL as non-disabled people, providing an estimate of average additional costs. Melnychuk et al. (2018) estimated the cost of child disability in the United Kingdom using a similar approach.
We tested the feasibility of a matching approach for NZ, using many of the matching variables used in Hancock et al. (2013) and Melnychuk et al. (2018) and the pooled HES data. Surprisingly, we found that households with a disabled person had somewhat lower incomes than matched households without a disabled person and the same SOL, on average. This implied negative costs of disability (ie. households with a disabled person achieved a given SOL with lower income than the matched households). This held both before and after matching on other characteristics of the households.[17] Results were not sensitive to the choice of matching variables, choice of matching algorithm, or other matching settings. Results were also relatively invariant to choice of SOL measure,[18] disability identifier,[19] and specification of income. Apart from tenure, we were unable to include variables representing household assets or savings which were included in the UK studies. However we did have data on the net worth of a subset of respondents.[20] Results were unchanged following the inclusion of this variable.
There are several possible reasons for the negative cost of disability estimate. While the SOL measures we use[21]were designed to be relevant to the needs of the NZ population, items may not be of equal relevance to disabled people. Items which are of particular importance to many disabled people may be missing. Additionally, some costs of disability may already be met through supports provided by government, non-government organisations, or family, whānau and friends. These may enable disabled people to achieve a higher SOL than they otherwise could, and substitute at least part of the requirement for additional income. Although we were able to explore an indicator of disability derived from the Washington Group questions, we did not have access to the responses to the underlying questions, and so could not test the sensitivity of our results to alternative specifications, such as those identifying severe disability. Given previous studies have shown that costs often increase with severity of disability (Mitra et al., 2017), this could have limited our ability to identify additional costs.
We hypothesise that a more plausible explanation is that in matching on SOL and a wide range of other characteristics such as education, we arrived at comparison groups that despite having no disabled person in the household as measured by HES data, faced other significant challenges to their material wellbeing and income earning potential. For example, the Washington Group questions do not capture all disabled adults and children. As a result, the comparison group will have included households with people who are neurodiverse or have intellectual disability, mental illness, addiction, chronic disease, rare conditions or fluctuating impairments, but who do not have any of the impairments captured by the Washington Group questions. In addition, the comparison group will have included include households with people who are not disabled but for whom other life events and barriers impose costs, cause SOL to be lower than would be expected given their education level, and restrict their incomes (e.g. people with sole care of children, past justice system involvement, or qualifications that are not recognised in NZ).
Discussion
This article aims to improve the evidence base to inform policy responses to inequities in material hardship rates according to whether children live in a household with disabled people or not. It uses pooled HES data and estimates that, on an equivalised income basis, households with children and with a disabled person need $8,400 to $24,000 more income per annum (an extra 17 to 55 percent) to match the SOL of households with children and with no disabled person on incomes ranging from $20,000 to $40,000.
The income shortfall is lower for Māori than non-Māori at $20,000 and $30,000, and similar for the two groups at $40,000. At all these income levels, more deprivation is experienced by Māori households on average, even when there is no disabled person in the household. This underscores the range of other factors that increase the risk of material hardship for Māori (Himona et al., 2019; King, 2019; Ingham et al., 2022; Wilson and McLeod, forthcoming). Possible explanations for the lower estimated income shortfall at $20,000 and $30,000 include more natural supports from whānau and community.
We do not provide an estimate of the overall average additional income needed across the income distribution. We explored the feasibility of two approaches that provide such estimates and found neither satisfactory. This was due to a combination of limitations of the methods and the nature of the NZ data. In the case of regression-based approaches, these assume that the cost of disability is either constant or increasing across the income distribution. Neither assumption appeared valid for NZ. In the case of a matching approach, this requires certainty that the comparison group does not include disabled people. This could not be guaranteed with the Washington Group indicator available to us. It is also likely that the comparison group will include other groups for whom barriers to inclusion cause low SOL at a given education level, and also cause income to be low. This does not offer a sound comparison for identifying additional costs faced by disabled people.
Importantly, we do not characterise our estimates as cost-of-disability estimates. Aside from household size and composition, we do not control for factors other than cost of disability that can influence SOL at a given income. Our estimates may reflect additional direct costs of disability. But they could also partly reflect the effects on SOL of other factors such as lower financial assets, poorer housing, location outside main centres, or lower education levels. These factors, in turn, may or may not themselves be caused by disability which makes it questionable whether they should be controlled for if the aim is to shed light on the costs of disability.
In practice, there are associations between disability and a range of inequities (Stats NZ, 2014; Stats NZ, 2020; Himona et al., 2019; King, 2019; Beltran-Castillon and McLeod, 2023; Marks et al., 2023) and intersectionality between ableism, disableism, racism and other forms of discrimination (Ingham et al., 2022; Cram et al., forthcoming; Gray and Stratten, forthcoming). In addition, reverse causality may be at play whereby lower SOL causes mental and physical health and injury risks that make it more likely that there is a disabled person in the household. This includes the potential for lagged effects of low SOL early in the lifecourse on health and impairments in adulthood, and interplay between age at onset and the opportunity to accumulate human capital and financial assets. All these factors make disentangling independent causal effects of disability difficult.
Notwithstanding these estimation difficulties, our findings agree with international research in showing that substantially more income is needed by households with a disabled person to achieve the same standard of living as other households. Regression-based SOL estimates from a pooled study of 15 European countries that show around 30 to 44 percent more income is needed for households with a disabled adult aged 50-65 (Morris and Zaidi, 2020). The matching-based estimates for older disabled British people (Hancock et al., 2013) equate to around $NZ7,000 to $NZ9,000 (in 2022 dollar terms). Those for the most disabled UK children (Melnychuk et al., 2018) equate to around $NZ7,000 to $NZ10,000.
Our findings also concur with other research in suggesting that additional costs borne by households with a disabled person that are not being met by income support payments and allowances and other supports are likely to be part of the explanation for material hardship among NZ children (Wynd, 2015; Murray, 2018; Wilson and McLeod, forthcoming). While qualitative interviews show that government, families, whānau, friends and community agencies provide important formal and informal supports, the overwhelming impression is one of many disabled people in households on low- and middle-incomes having unmet need, and hardship or having only just enough to get by in spite of these supports (Wynd, 2015; Cram et al., forthcoming; Gray and Stratten, forthcoming). Useful areas of focus for efforts to reduce hardship would be improving income support payments and services that support employment, and improving income support payments such as Disability Allowance and Child Disability Allowance, and other supports that help with the additional costs of disability.
These payments and supports are currently received in only a minority of households where children live with a disabled adult or child (Suri and Johnson, 2016; Wilson and McLeod, forthcoming). More research to better understand the extent to which increased uptake of available payments and supports could help reduce hardship would be useful (Wynd, 2015; Wilson and McLeod, forthcoming). Awareness of supports appears to be an issue (Suri and Johnson, 2016). In the New Zealand Income Support Survey, one in five respondents who said they had a child with a physical, sensory, psychiatric, or intellectual disability were not aware of the Child Disability Allowance.[22] However, we note that even if a household with a disabled child missing out on Disability Allowance and Child Disability Allowance were to receive these payments, this would yield at most $7,167 per annum. This amount would not fully address even the smallest of the average income shortfalls we estimate. It would therefore be useful to consider policies that improve the adequacy of payments and supports, as well as those that broaden coverage, access, and uptake (Morris, 2021).
Based on the Washington Group measure used in the HES, almost three in every ten children live in a household with a disabled person (likely an underestimate given the limitations of the measure[23]). This means policies addressing the high rate of material hardship for children in households with a disabled person is important to the wellbeing of a sizeable share of the population of children. Such policies could contribute to both future child poverty reduction efforts and to meeting obligations under the United Nations Convention on the Rights of Persons with Disabilities which require ratifying countries to safeguard and promote the right to an adequate standard of living and social protection for disabled people.[24] They could also form part of an early intervention social investment approach. Helping ensure disabled children and adults get the resources, therapies and services they need early may improve the trajectory of their lives and reduce future costs.
Key strengths of our approach are its transparency and simplicity, and that it avoids difficulties encountered with regression and matching SOL approaches. A key limitation is that while we provide useful new insights into the range of additional income needed to address higher deprivation for children in households with disabled people, we are unable to offer insights into the degree to which the income shortfall results from costs of disability. Nor can we shed light on how much additional income would be required to reduce material hardship rates to below certain levels, or whether income shortfalls would be best met through income support payments or direct supports. In addition, as with the regression and matching approaches tested, we are limited to a single indicator of disability status in which some disabled people appear as not disabled, and we are unable to consider variation in income shortfalls by the nature and severity of disability.
Potential areas for further research include estimating the aditional income needed to address higher rates of material hardship and severe material hardship (i.e. to equalise proportions with 6 or more and 9 or more Dep-17 items), exploring variation in costs faced by people with different types and degrees of disability,[25] exploring differences between Māori and non-Māori in more detail, and investigating the feasibility of developing an approach to income equivalisation in income-poverty monitoring that takes into account additional costs of disability.
Conclusion
Substantial increases in income and/or direct supports for households with disabled people would be needed to address higher levels of deprivation for children in these households when compared to children in households with no disabled person. The increases needed are higher when there are two or more disabled people in the household.
References
Beltran-Castillon, L., and McLeod, K. (2023) From Data to Dignity: Health and Wellbeing Indicators for New Zealanders with Intellectual Disability, IHC. https://www.ihc.org.nz/publications/from-data-to-dignity-health-and-wellbeing-indicators-for-new-zealanders-with-intellectual-disability
Cram, F., Adcock, A., Tipene, D., Tuteao, H., and Were, L. (forthcoming). In-depth study to understand costs and income support for Tāngata Whaikaha Māori me o rātou whānau, and Māori living with long-term health conditions. A study by Katoa Ltd for the Ministry of Social Development.
Disability Resource Centre (2010) The Cost of Disability - Final Report, Report prepared for the Ministry of Social Development and the Office for Disability Issues. https://view.officeapps.live.com/op/view.aspx?src=https%3A%2F%2Fcarers.net.nz%2Fwp-content%2Fuploads%2F2013%2F02%2F2010Cost-of-Disability-Report.doc&wdOrigin=BROWSELINK
Doran, B., Crossland, K., Brown, P., & Stafford, L. (2022). Transport experiences of disabled people in Aotearoa New Zealand, (Report No. 690). Waka Kotahi NZ Transport Agency research. Research Report 690 Transport experiences of disabled people in Aotearoa New Zealand - summary (nzta.govt.nz)
Godfrey, A.J.R., and Brunning, D.M. (2009) ‘Reconciling True and Incurred Costs of Blindness in New Zealand’, Social Policy Journal of New Zealand, 36, 208-216. https://www.msd.govt.nz/about-msd-and-our-work/publications-resources/journals-and-magazines/social-policy-journal/spj36/36-reconciling-true-and-incurred-costs.html
Graham, S. (2022) The New Zealand Income Support System as at 1 July 2022, Wellington, New Zealand: Ministry of Social Development.
Gray, R. and Stratton, G. (forthcoming) Extra costs and income support experiences for disabled people and people with long-term health conditions. Wellington: Allen + Clarke and All is for All. A report prepared for the Ministry of Social Development.
Hancock, R., Morciano, M., and Pudney, S. (2013) Nonparametric estimation of a compensating variation: the cost of disability, Institute for Social and Economic Research.
HealthiNZ (2024) Impact of living a rare disorder in Aotearoa New Zealand. Key priorities to deliver improved outcomes for people living with rare disorders, their family and whānau. HealthiNZ. 5295_RDNZ_White-Paper-Layout_WEB.pdf (raredisorders.org.nz)
Himona, P., Talamaivao, N., Yeh, L., and Paterson, L. (2019) Māori Health Disability Statistical Report, Report prepared for the Waitangi Tribunal (Report No, Wai 2575, #B24). https://forms.justice.govt.nz/search/Documents/WT/wt_DOC_151847905/Wai%202575%2C%20B024.pdf
Ingham, T.R., Jones, B., Perry, M., King, P.T., Baker, G., Hickey, H., Pouwhare, R., and Nikora, L,W. (2022) ‘The multidimensional impacts of inequities for Tāngata Whaikaha Māori (Indigenous Māori with lived experience of disability) in Aotearoa, New Zealand’ International Journal of Environmental Research and Public Health19(20):13558. https://doi.org/10.3390/ijerph192013558
Jeffreys, M., Pledger, M, McKenzie, F., Ellison-Loschmann, L., Irurzun Lopez, M., and Cumming, J. (2024) ‘Consequences of cost barriers to prescriptions: cohort study in Aotearoa New Zealand’ New Zealand Medical Journal, 137(1595), 48-63. https://doi.org/10.26635/6965.6431
King, P.T. (2019) Māori With Lived Experience of Disability Part I. Report prepared for the Waitangi Tribunal (Report No. Wai 2575, #B22). https://forms.justice.govt.nz/search/Documents/WT/wt_DOC_150437272/Wai%202575%2C%20B022.pdf
Marks, E.J., Tait, J., Miller, D., Liang, R., Bullen, P., Fenaughty, J., Grant, C., and Paine S. (2023) Growing up in New Zealand. Now we are 12. Life in early adolescence. Disability – The impact of disability on young people and their family. The impact of disability on young people and their family (growingup.co.nz)
Melnychuk, M., Solmi, F., and Morris, S. (2018). ‘Using compensating variation to measure the costs of child disability in the UK’, European Journal of Health Economics, 19, 419-433.
Mitra, S., Palmer, M., Kim, H., Mont D., and Groce, N. (2017) ‘Extra costs of living with a disability: a review and agenda for research’, Disability and Health Journal, 10(4), 475-484. https://doi.org/10.1016/j.dhjo.2017.04.007
Mont, D. (2023) ‘Estimating the extra disability expenditures for the design of inclusive social protection policies’, Front Rehabil Sci, 31(4) 1179213. https://doi.org/10.3389%2Ffresc.2023.1179213
Morris, Z.A. (2021) ‘Making ends meet on disability benefits: how well do programs decommodify?’ Alter. 15(1), 15–28. https://doi.org/10.1016/j.alter.2020.06.013
Morris, Z. A., and Zaidi, A. (2020) ‘Estimating the extra costs of disability in European countries: Implications for poverty measurement and disability-related decommodification.’ Journal of European Social Policy, 30(3), 339-354. https://doi.org/10.1177/0958928719891317
Murray, S. (2018) ‘Breaking the link between disability and child and whānau poverty’, Policy Quarterly, 14(4), 68-77. https://doi.org/10.26686/pq.v14i4.5151
Norris, P., Cousins, K., Horsburgh, S. et al. (2023) ‘Impact of removing prescription co-payments on the use of costly health services: a pragmatic randomised controlled trial’, BMC Health Serv Res, 23, 31. https://doi.org/10.1186/s12913-022-09011-0
Perry, B. (2022) Child Poverty in New Zealand, Ministry of Social Development.
Stats NZ. (2014) Disability Survey: 2013. Disability-Survey-2013 (1).pdf
Stats NZ. (2020) Measuring inequality for disabled New Zealanders: 2018. https://www.stats.govt.nz/reports/measuring-inequality-for-disabled-new-zealanders-2018
Stephens, M. (2022) Insights from New Zealand child poverty data, Treasury Analytical Note 22/04. https://www.treasury.govt.nz/publications/an/an-22-04
Suri, J. and A. Johnson (2016) Barriers to Support: uptake of the child disability allowance in Otara, Auckland: Child Poverty Action Group. Barriers to support: Uptake of the Child Disability Allowance in Otara — Child Poverty Action Group (cpag.org.nz)
Underwood, L., Teng, A., Bowden, N., Dewes, O., Marek, L and Milne, B. (2024) ‘Long-term health conditions among household families in Aotearoa New Zealand: cross-sectional analysis of integrated Census and administrative data’, New Zealand Medical Journal, 137(1596). 20-34. https://doi.org/10.26635/6965.6370
Washington Group on Disability Statistics (2020a) The Washington Group Short Set on Functioning – Enhanced (WG-SS Enhanced). https://www.washingtongroup-disability.com/resources/the-washington-group-short-set-on-functioning-enhanced-wg-ss-enhanced-167/
Washington Group on Disability Statistics (2020b) The Washington Group / UNICEF Child Functioning Module (CFM) – Ages 5-17 years. Child Functioning Module (CFM) – Ages 5-17 years - The Washington Group on Disability Statistics (washingtongroup-disability.com)
Washington Group on Disability Statistics (2020c) The Washington Group / UNICEF Child Functioning Module (CFM) – Ages 2-4 Years. https://www.washingtongroup-disability.com/resources/the-washington-group-/-unicef-child-functioning-module-cfm-ages-2-4-years-169/
Wilson, M. & McLeod, K. (forthcoming) Material hardship of children in households with a disabled person, Ministry of Social Development.
Wynd, D. (2015) ‘It shouldn’t be this hard’: children, poverty and disability, Auckland: Child Poverty Action Group. https://www.cpag.org.nz/publications/150317childdisabilitypdf
Moira Wilson is a Doctoral candidate in the School of Social Sciences and Public Policy at the Auckland University of Technology. She undertook the research on which this article is based while working as a Senior Analyst at the Ministry of Social Development.
Keith McLeod contributed to the research on which this article is based as a contracted research analyst.
Jonathan Godfrey is a Senior Lecturer in Statistics at Massey University and the National President of Blind Citizens NZ.
[1] Other payments such as Working for Families payments and Accommodation Supplement may be received in addition to health- and disability-related income support payments. Sole parents who are disabled or have a disabled child may receive Sole Parent Support rather than Supported Living Payment or Job Seeker – Health Condition or Disability. See Graham (2022) for a more detailed overview of the income support system.
[2] Where these apply, they count the income of the recipient and their spouse or partner.
[3] This does not usually cover additional primary health care costs such as those for electrocardiograms, vaccinations, dressings and diabetes support.
[4] Inclusive of the costs of the additional time required by disabled people in daily living.
[5] These are cubic spline curves. Cubic splines were chosen due to the simplicity of calculation and the smoothness of the resulting fitted curve. Spline curves were fitted with four knots placed approximately at the quartiles of the income distribution. Two knots were insufficient to capture the broad shape of the SOL-income curve, while five knots resulted in over-fitting to the data.
[6] I.e net income after deducting taxes and adding transfers (e.g. benefits and Working for Families tax credits) adjusted for household size and composition.
[7] Based on a sample of 4,893 households with children aged under 18 (1,785 with one or more disabled person, 3,108 with no disabled person).
[8] Based on a sample of 8,703 households with children aged under 18 (2,160 with one or more disabled person, 6,543 with no disabled person).
[9] This could be for various reasons, including recent migrants with low income earned in New Zealand but higher income earned elsewhere, self-employed with low taxable earnings, or people who have high asset wealth and low expenses, and are less reliant on income to maintain their SOL. In addition, very low incomes could result from reporting error or matching error resulting from the construction of the IDI.
[10] An enforced lack is an item that is wanted but not possessed because of the cost.
[11] Lower and upper quartiles in households with a disabled person were $28,000 and $51,000 respectively. Lower and upper quartiles in households with no disabled person were $33,000 and $62,000 respectively.
[12] Unless totally blind.
[13] This involves, e.g., examining the additional income needed by households with a Māori household member and with a disabled person when compared with households with a Māori household member and with no disabled person.
[14] Estimates could not be produced for households with adults aged 64 or over and with no children aged under 18 because there was no consistent relationship between income and SOL.
[15] For and in Box 5.
[16] Through its impact on the ratios in equations (2) and (3) in Box 5.
[17] Matching variables included the age of household members (age of oldest adult and youngest child in the household), number of adults and children in the household, ethnicity of household members, region, area deprivation, highest qualification of household members, and housing tenure.
[18] Apart from the deprivation index (Dep-17), we also tested our results on the Material Wellbeing Index (Perry, 2022, Appendix 1) and a self-reported question about income sufficiency.
[19] We did not have detailed Washington Group screening questions, so were unable to construct alternative measures based on type or severity of disability. However we did have access to administrative data on chronic health conditions from hospital admissions.
[20] A wealth supplement to the HES is undertaken every three years, but is only administered to a subset of HES participants. In our sample, we therefore were able to derive wealth data for a subset of respondents to the 2020/21 HES.
[21] Dep-17 (see Box 3) and the Material Wellbeing Index (Perry, 2022).
[22] Source: MSD unpublished tables.
[23] Underwood et al. (2024) find that among multi-person families living in the same household, 60 percent include at least one person with one of nine selected long-term health conditions (cancer, chronic obstructive pulmonary disease, heart disease, diabetes, dementia, gout, stroke, traumatic brain injury, or mental health/behaviour conditions).
[24] Article 28 - Adequate standard of living and social protection | Division for Inclusive Social Development (DISD) (un.org)
[25] This would require more detailed information on responses to HES Washington Group questions than is currently available to researchers.
Originally published in Policy Quarterly by Te Herenga Waka | Victoria University of Wellington.
New Zealand's Disability Allowances are Failing Disabled Children